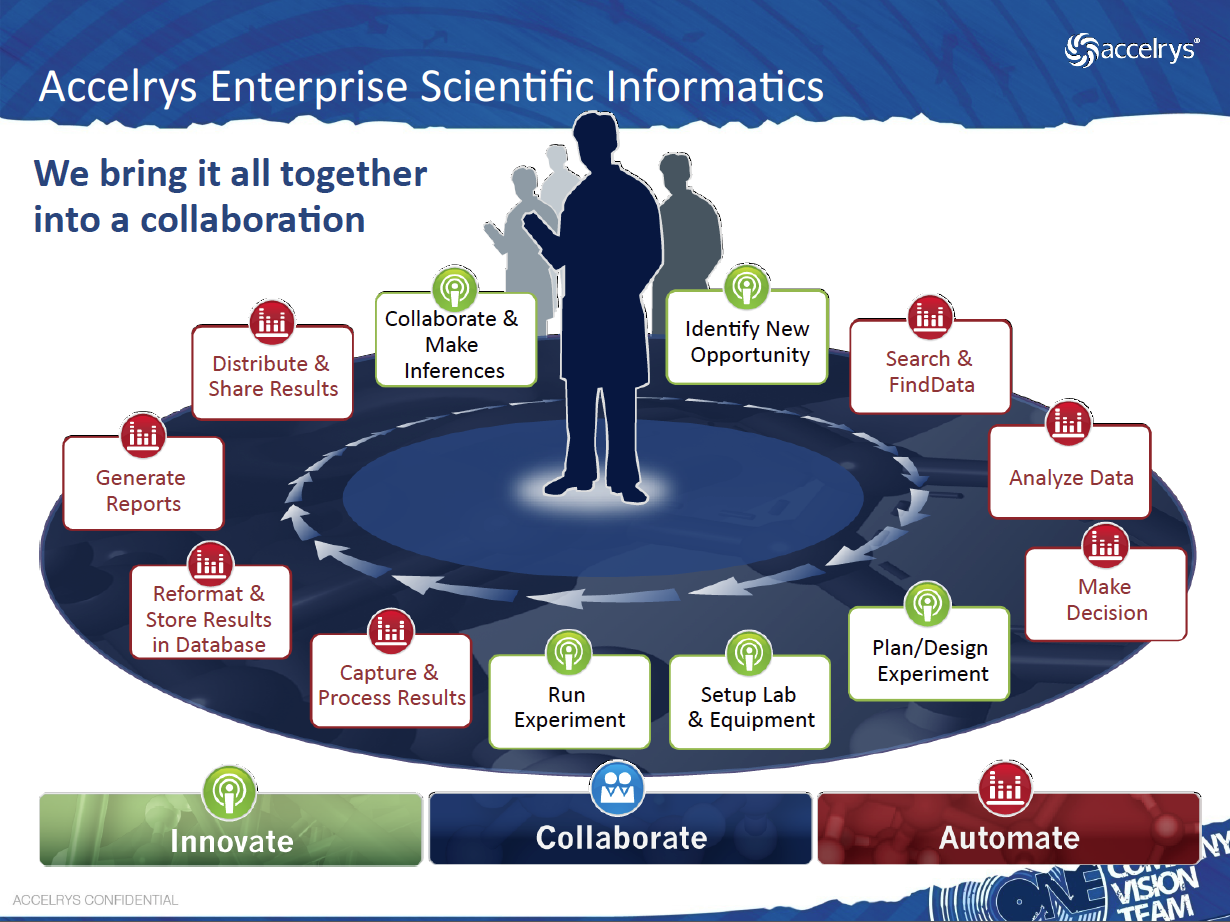
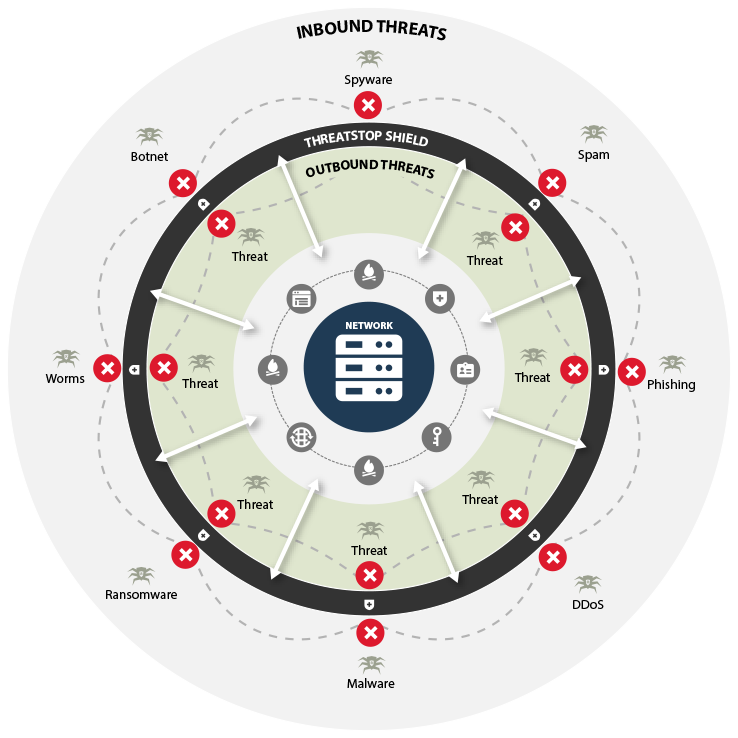
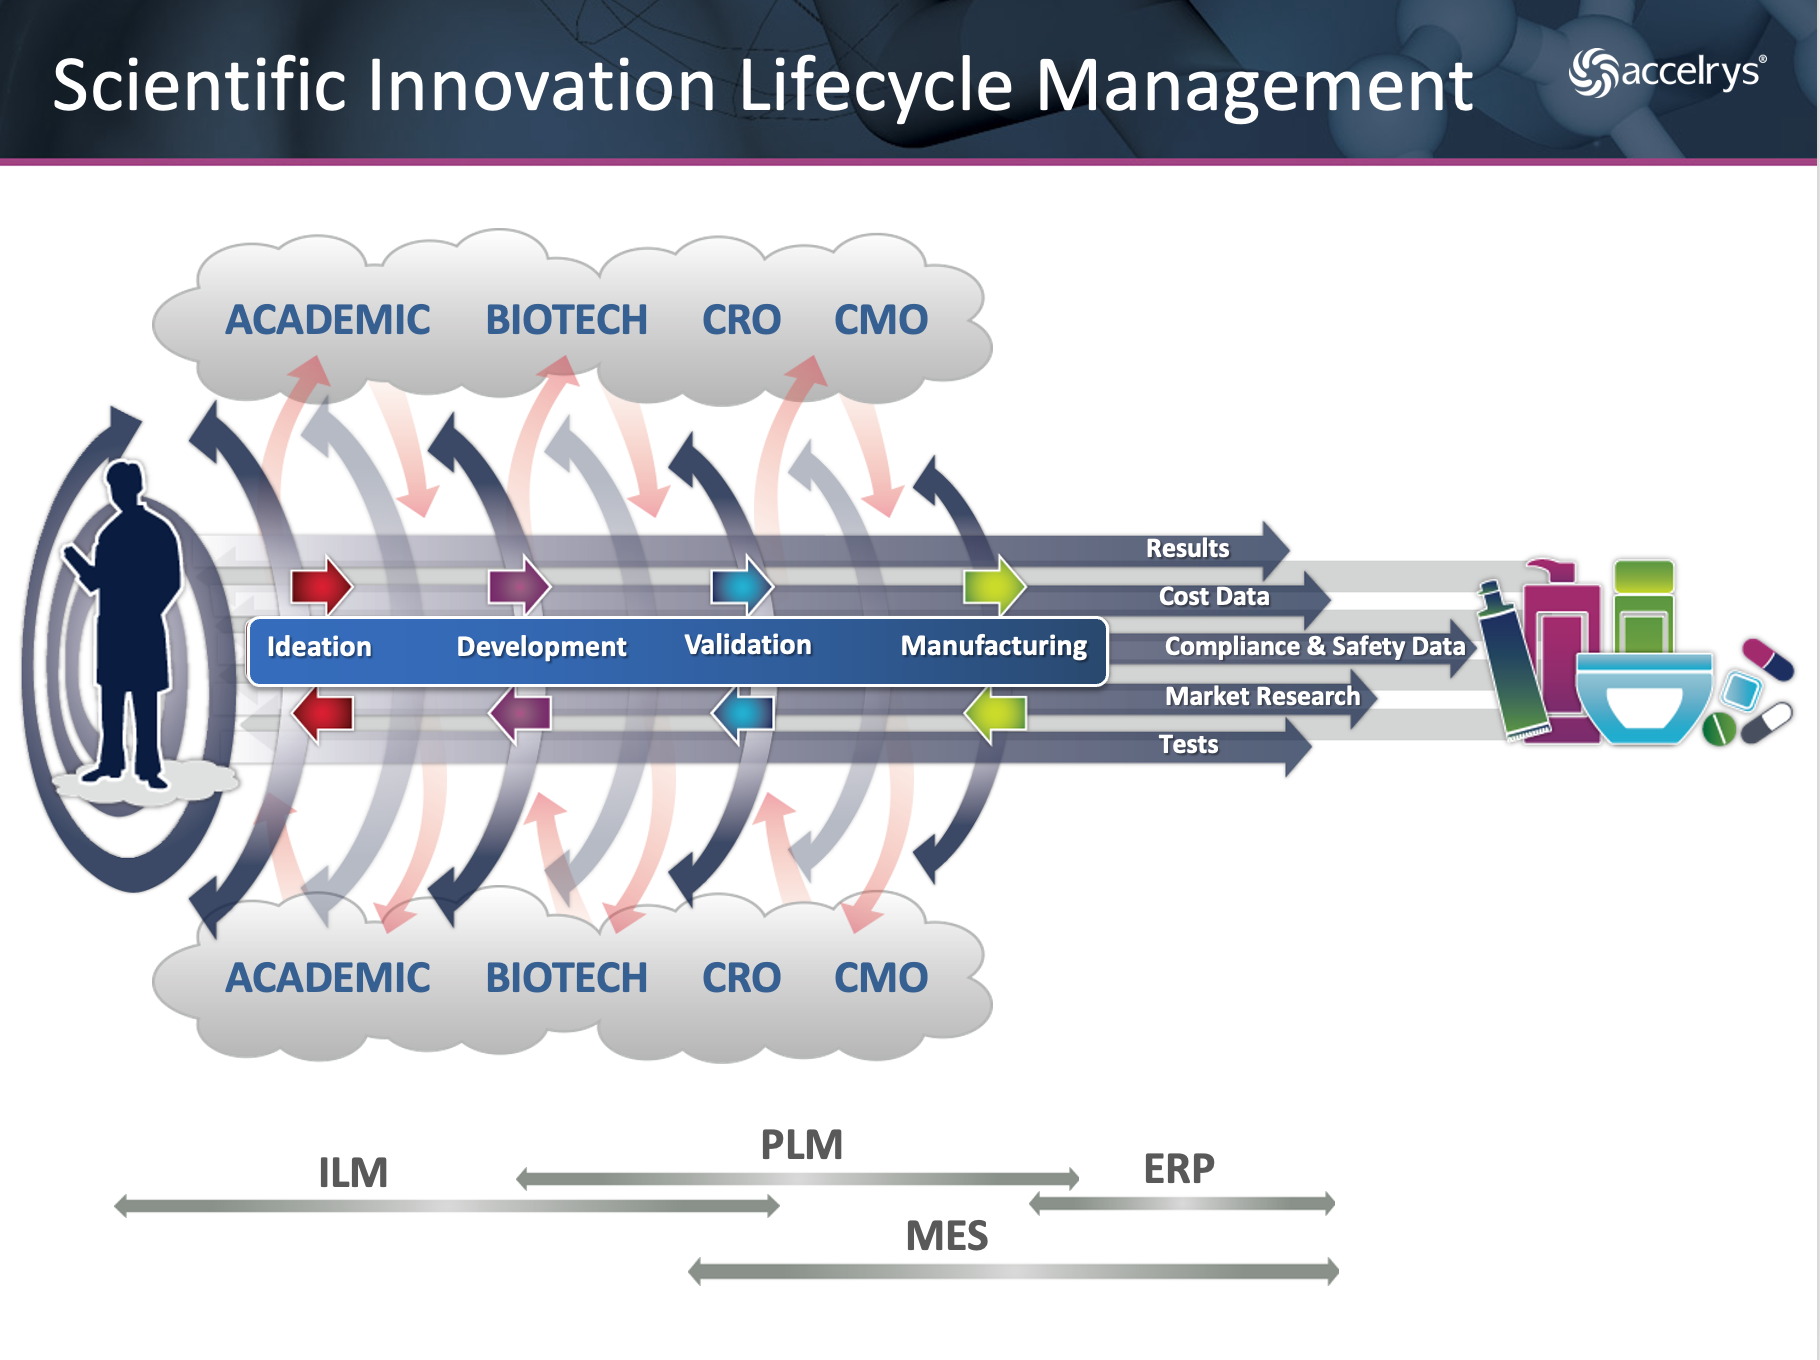
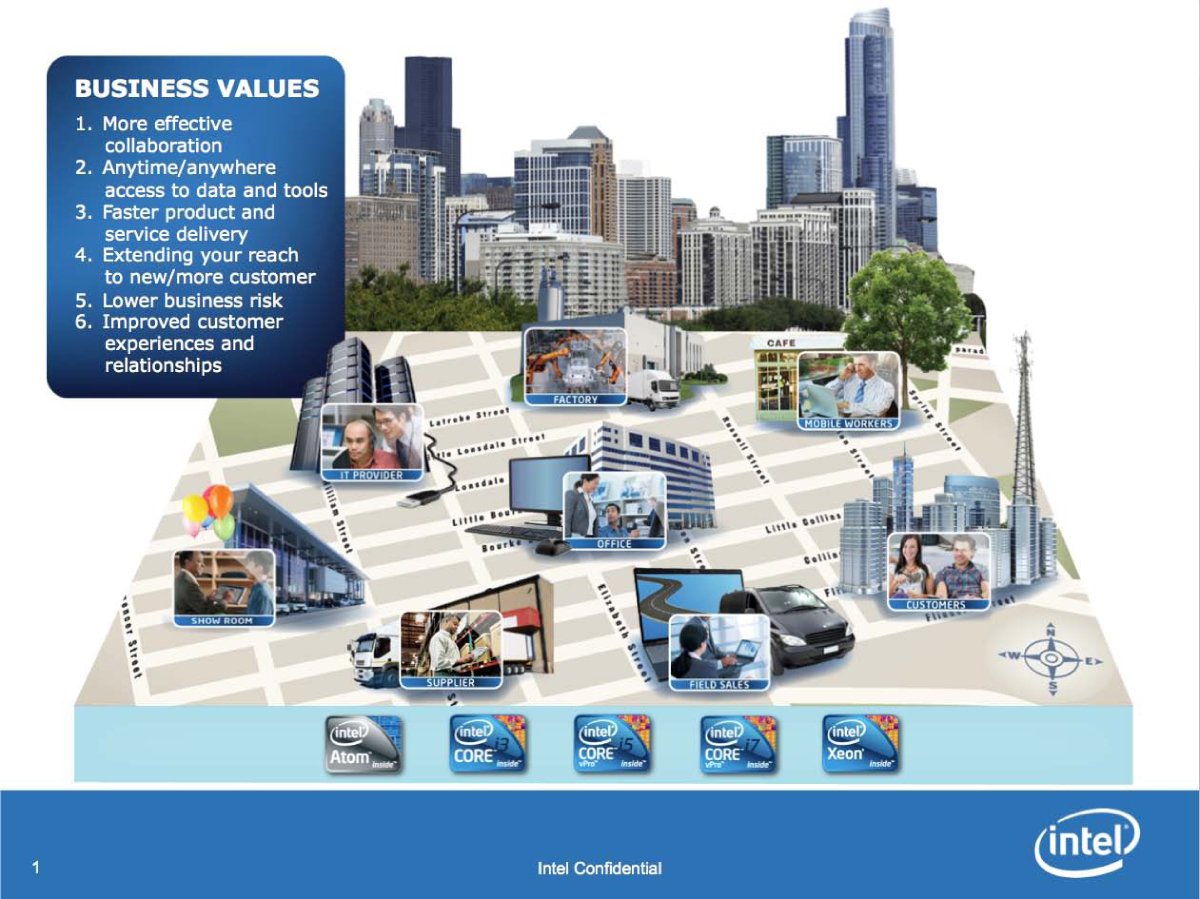
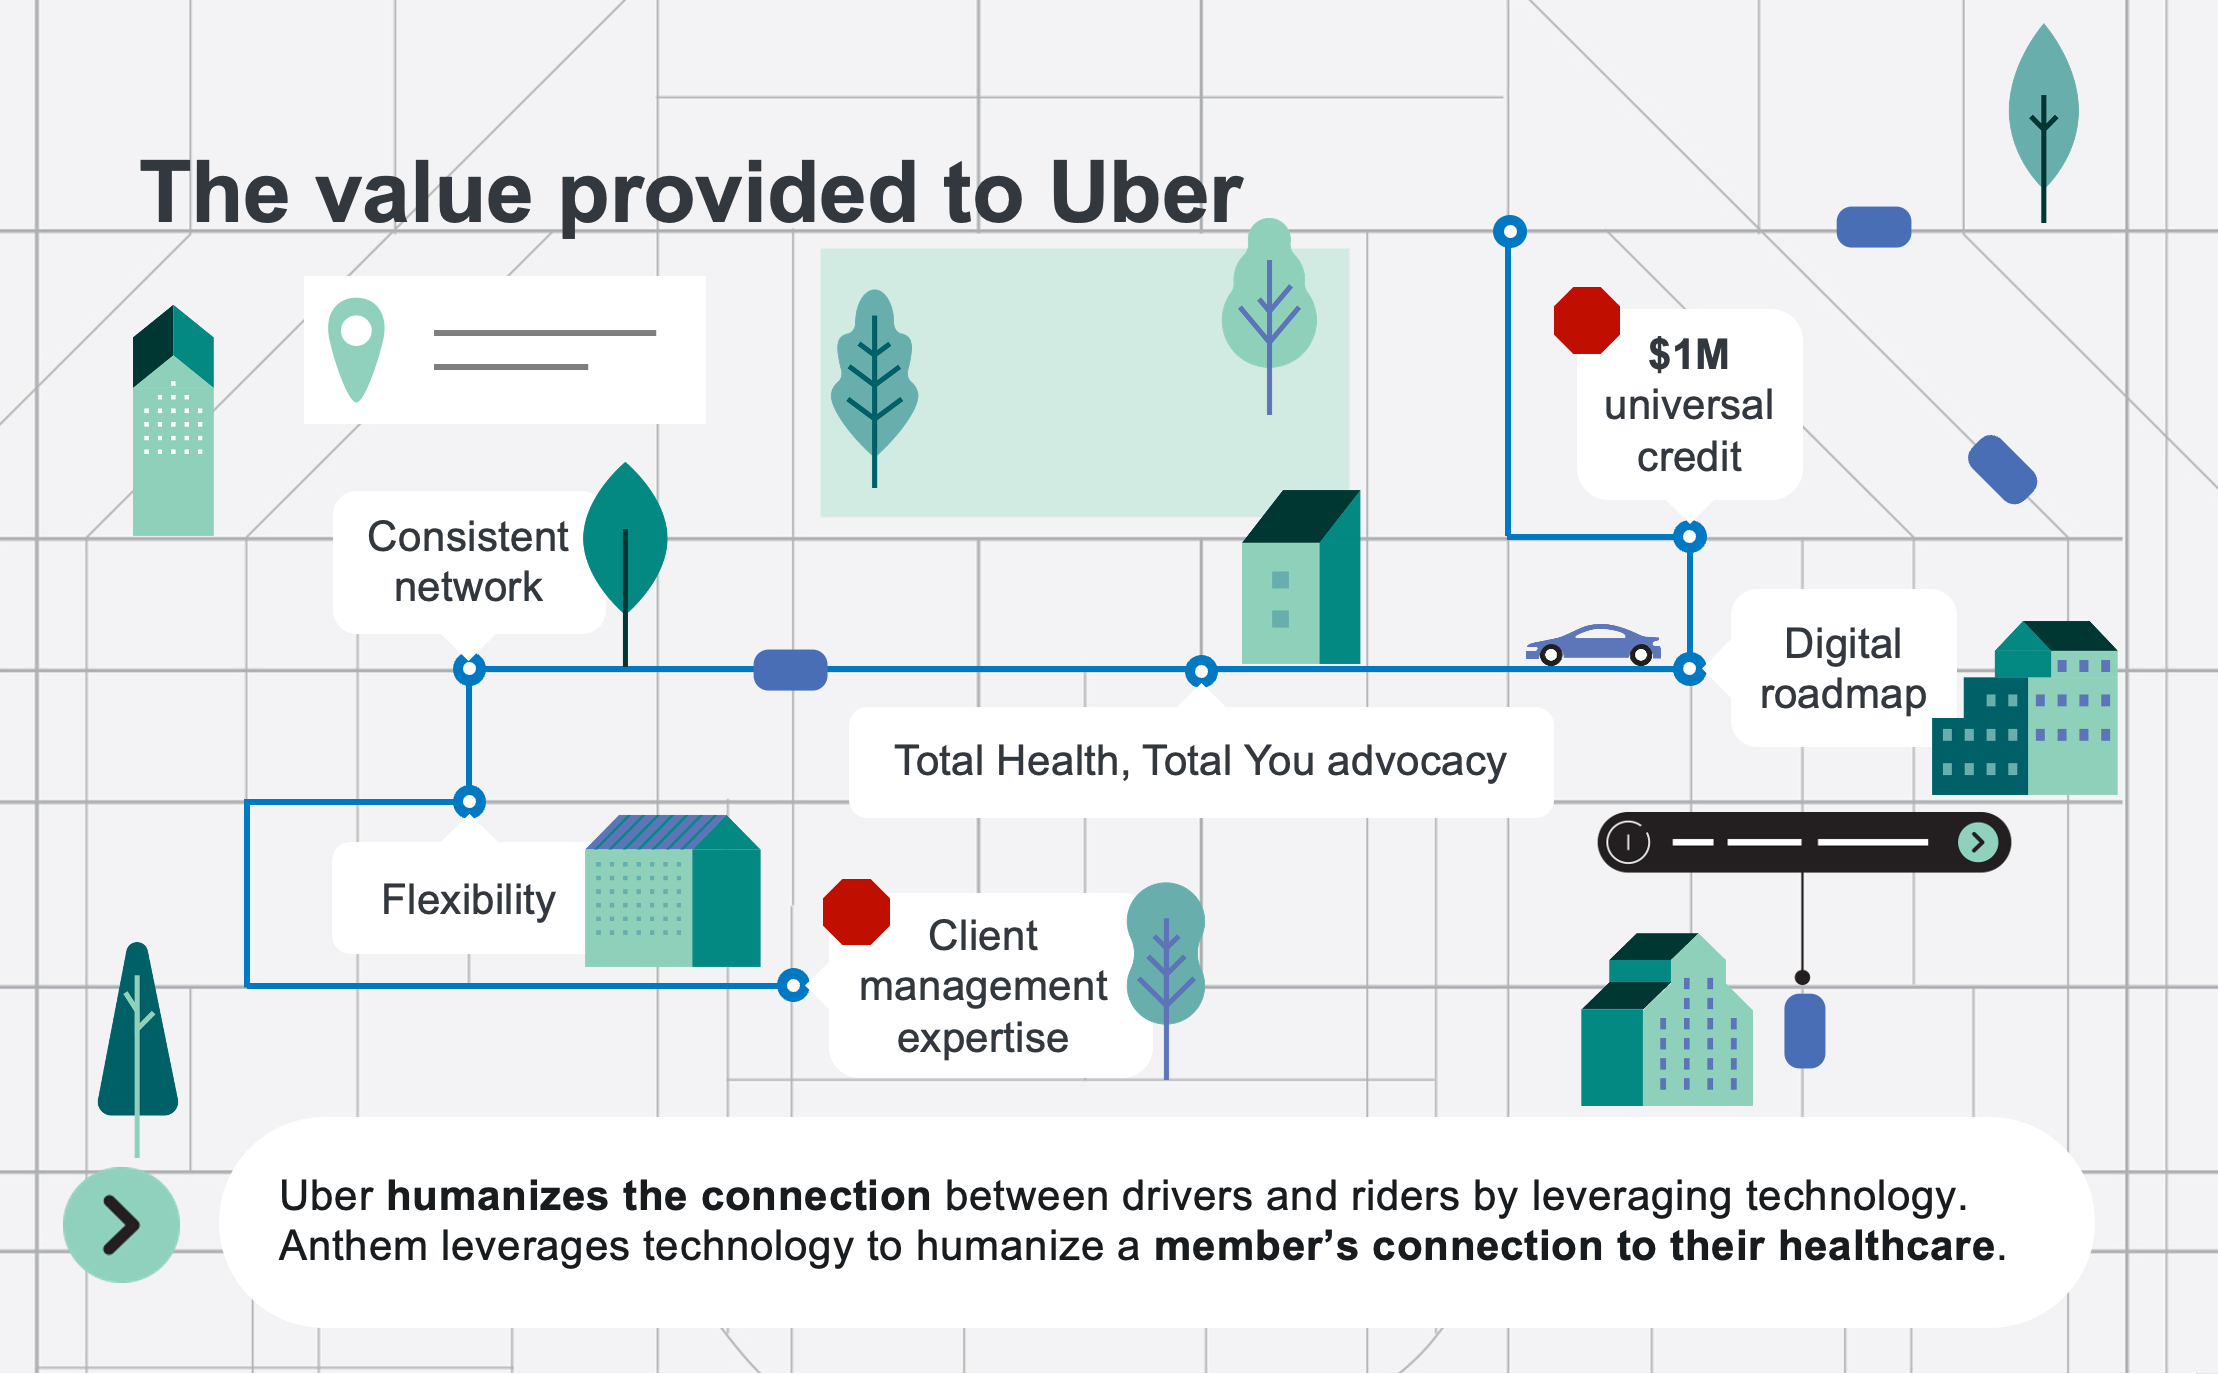
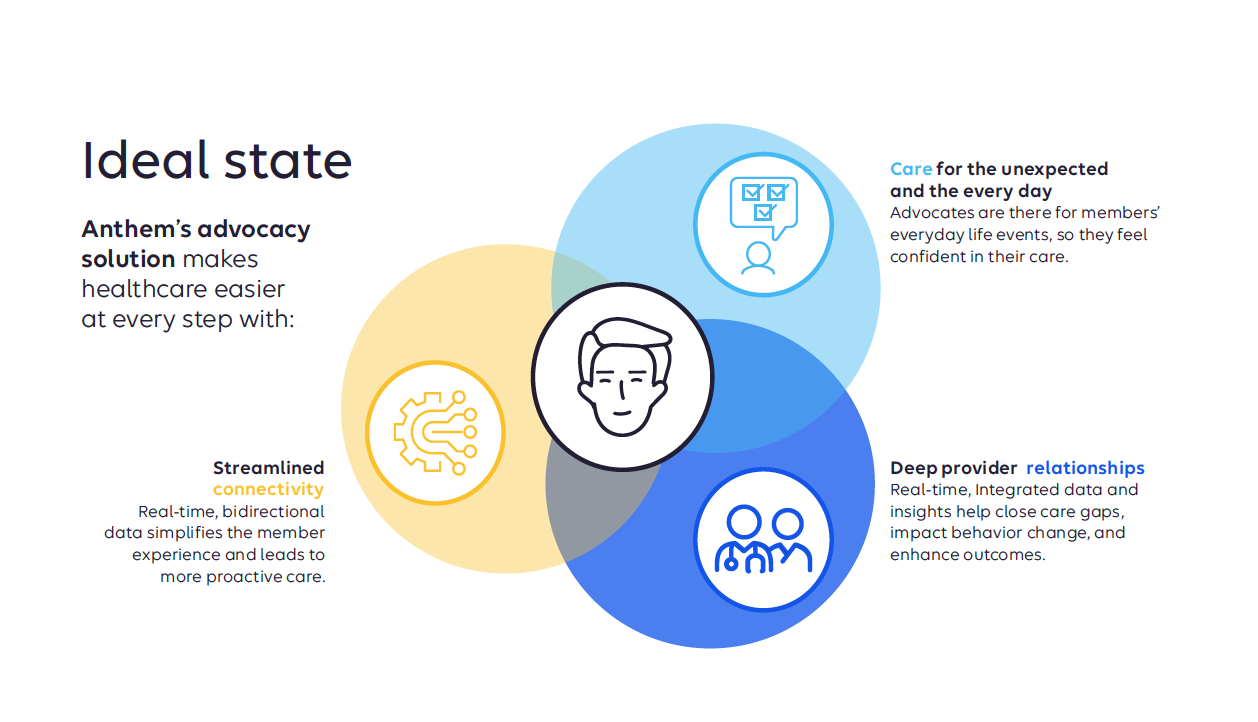
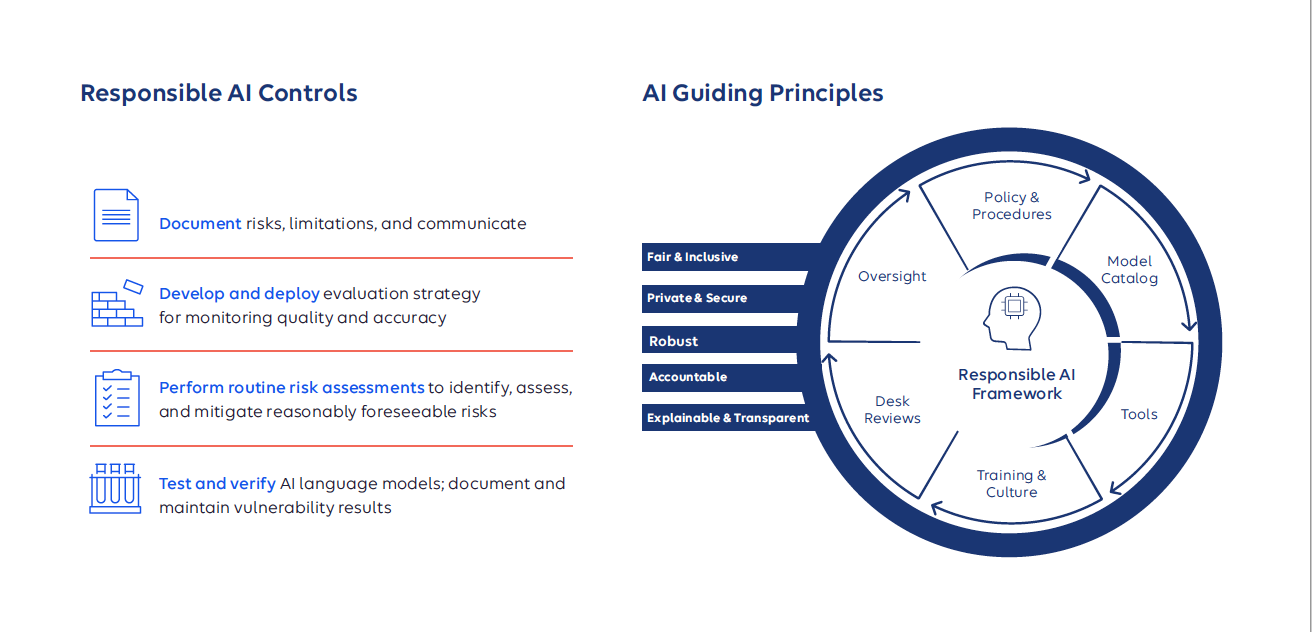
Infographics help to take complex concepts and simplify them to help the end user understand the content, sometimes for a quick read, or a more in-depth look at a complicated story.
Infographics can be visual data, charts, and statistics. Using color, proportion, and negative space, this information can be transformed into memorable, attention-grabbing, and persuasive graphics. When developing them for pharmaceutical, scientific, or healthcare needs, they can get complex and may need the assistance of added copy, more speaker notes, or an in-person presentation to develop the content further.

